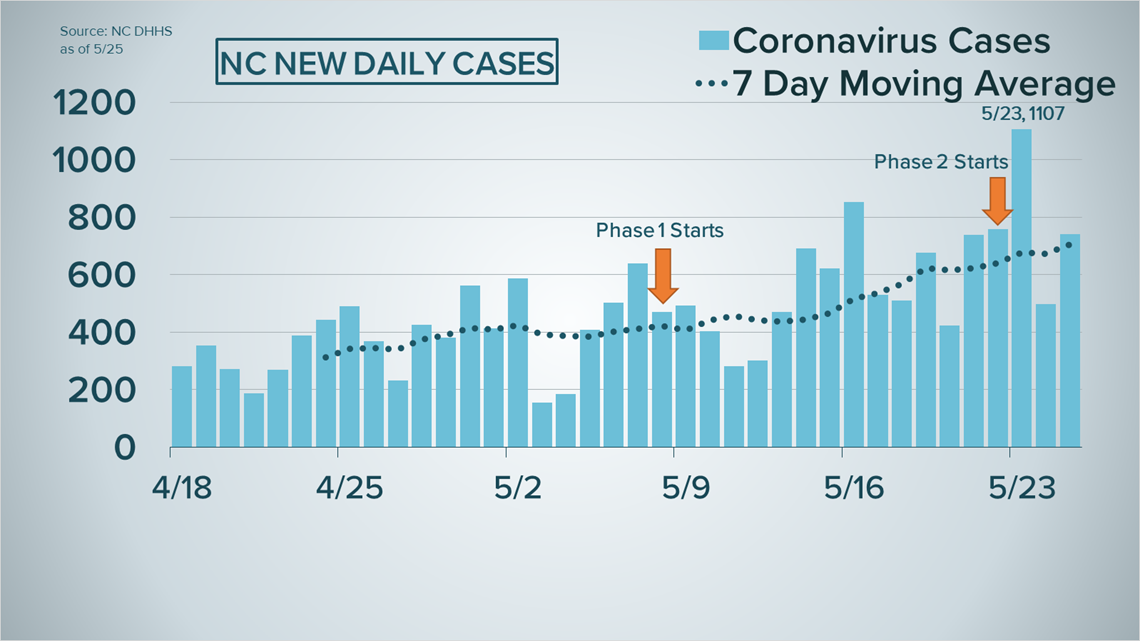
CHARLOTTE, N.C. — As North Carolina settles into phase two of reopening, we're taking a look at the four key metrics state health officials consider when considering reopening policies.
Those metrics are the number of coronavirus cases, the percentage of positive tests, hospitalizations, and reports of COVID-19-like symptoms.
The state's total cases continue to grow. In fact, over the weekend, North Carolina reported its largest one-day increase. The spike happened Saturday, the day after phase two began, with 1,107 new cases.

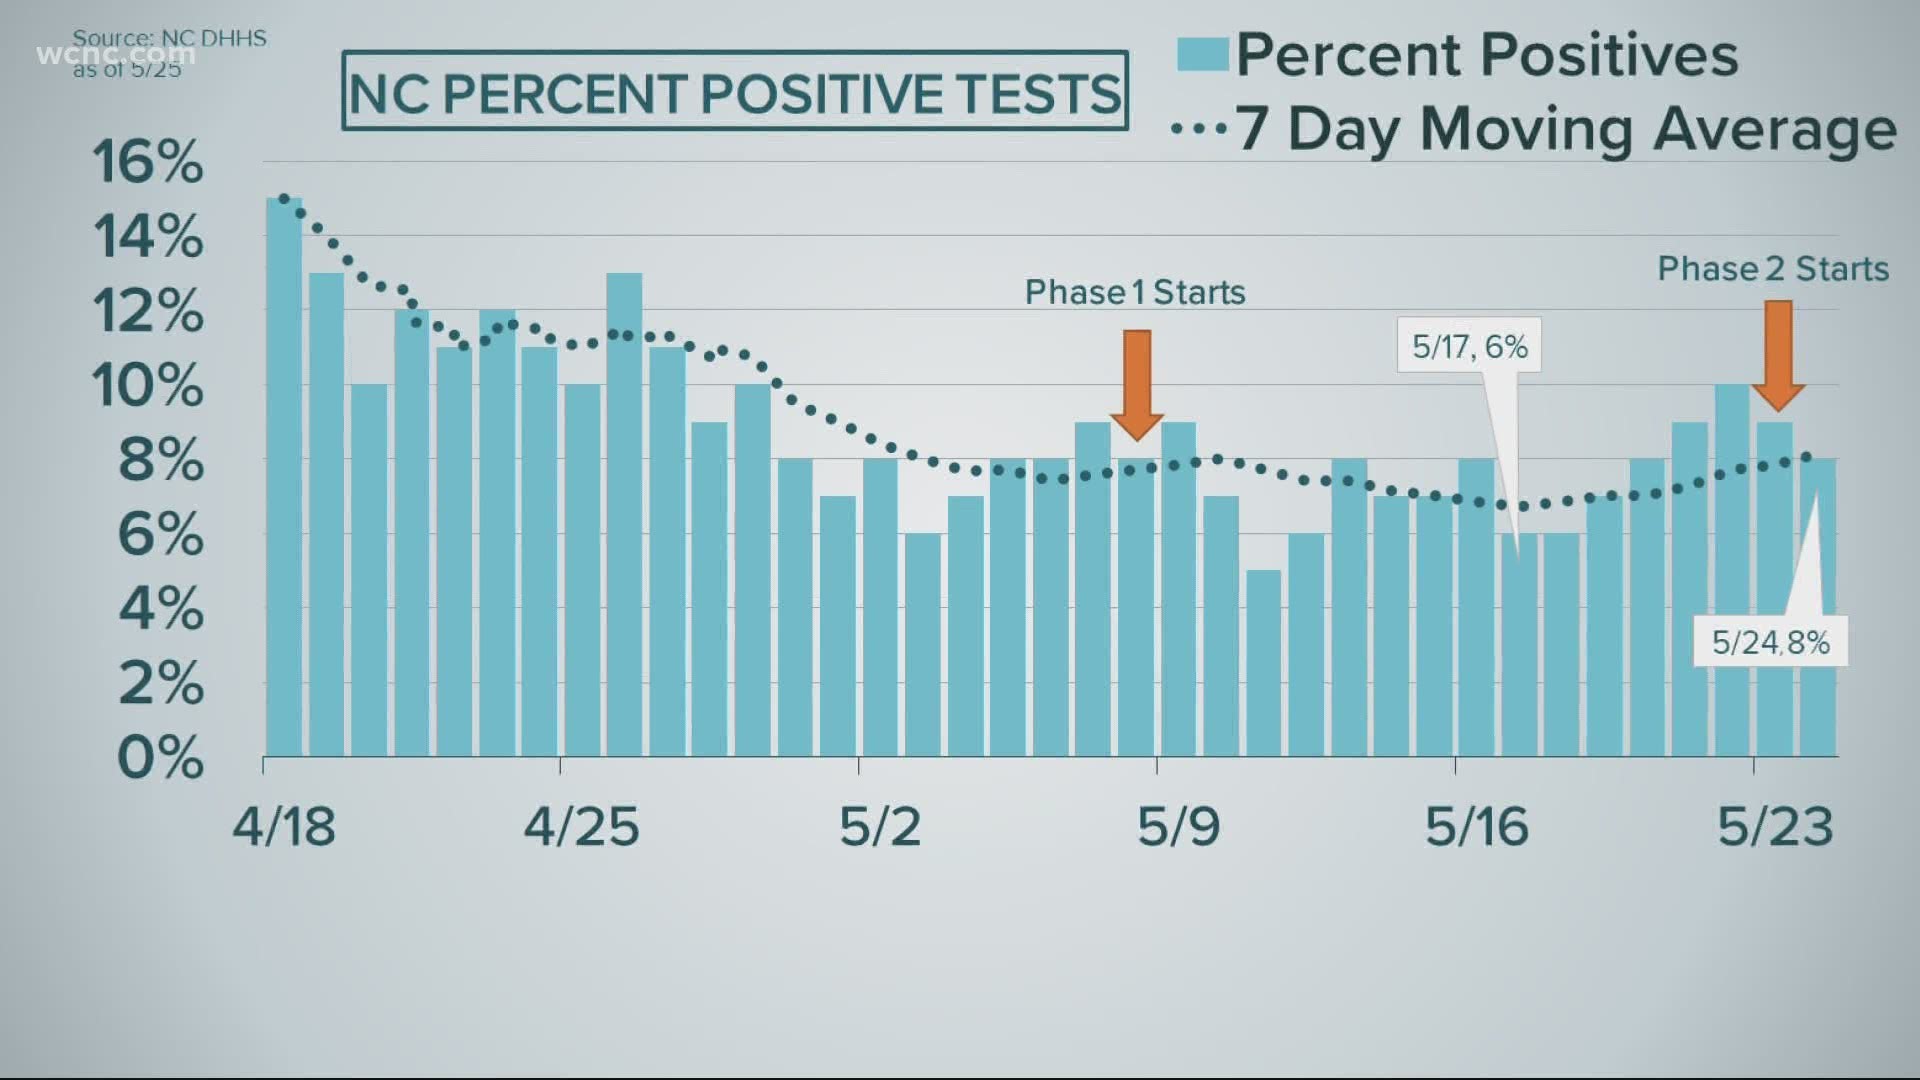
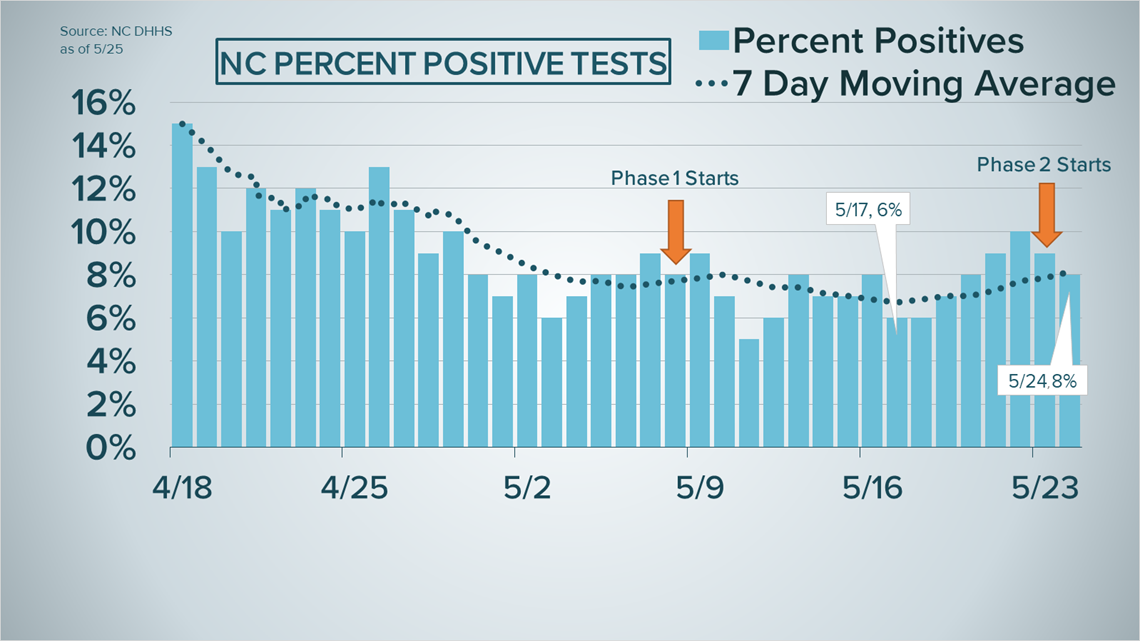
For context, we should mention testing has also increased in recent weeks. So, it's important to see if the percentage of people testing positive has gone up.
The dotted line on the graph below is a 7-day moving average. It helps delineate a general trend, instead of just taking one day of data, which could have an anomaly.
On May 17, around nine days after phase one began, the trend line starts its steepest, most sustained growth over the past month, continuing through Sunday, May 24.

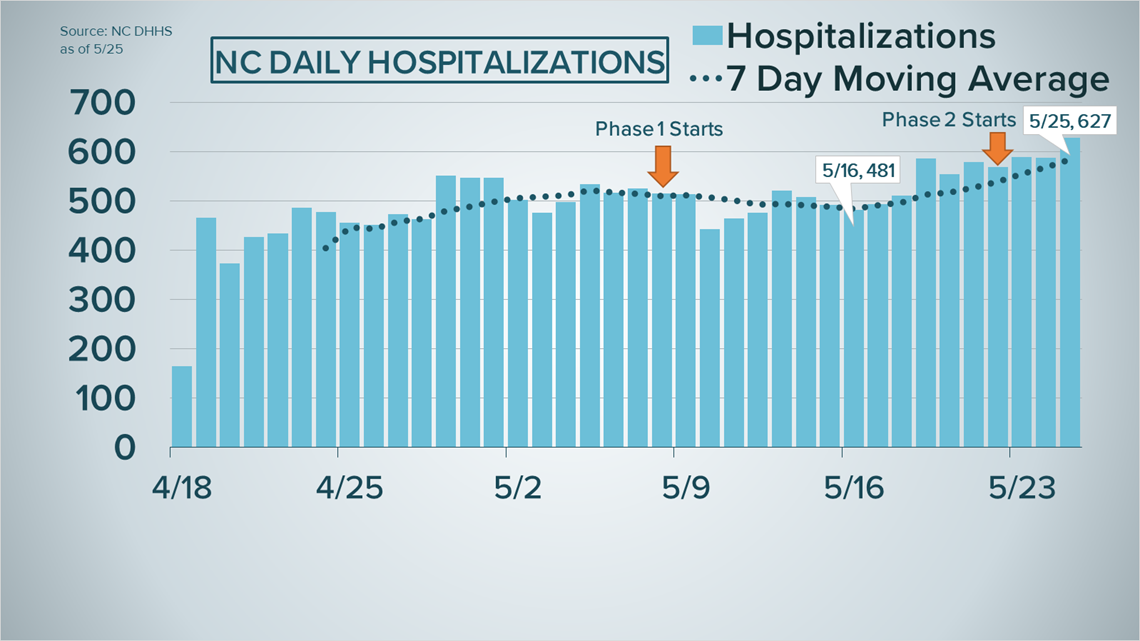
The hospitalizations data below shows a largely flat trend line in the couple weeks before phase one, with a slight increase leading up to it, and a slight decrease for a few days after.
However, right around the same time percent positives started their most recent growth, a similar trend begins with hospitalizations.
The line trends back up, starting around May 16, for more than a week to the all-time high of 627 hospitalizations reported Monday.

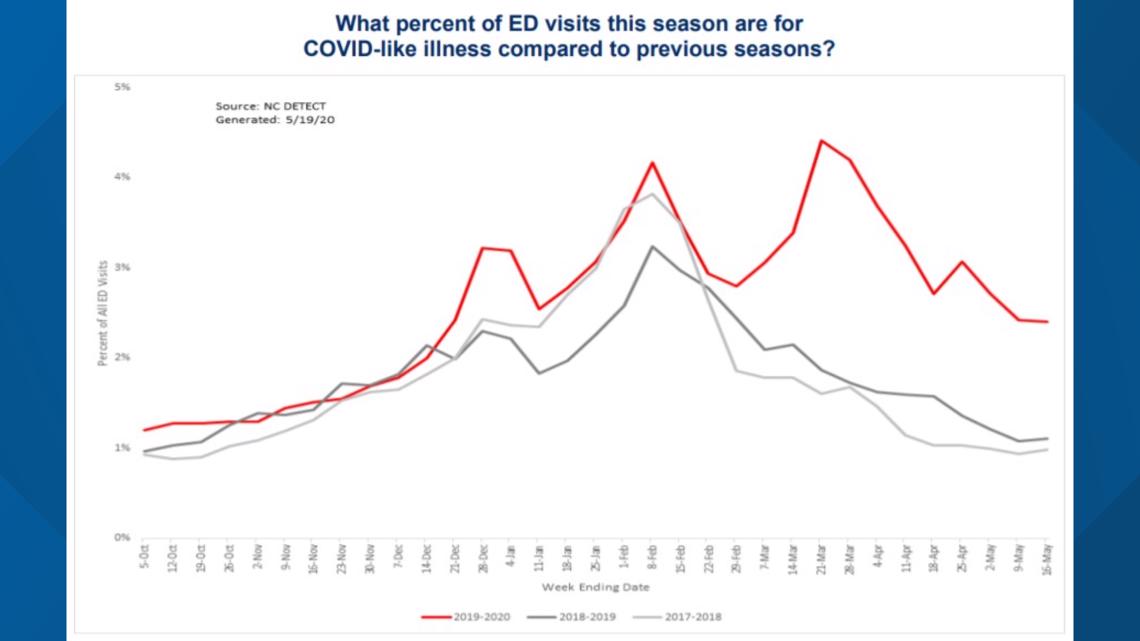
Finally, the graph below is from North Carolina Health and Human Services. It shows reports of COVID-19-like symptoms. The state updates this report every Thursday, so it's not as up-to-date as the figures above.
However, according to the latest graph, this is the only metric with a definitive decline in recent weeks, and a decline is what the state wants to see.

Every Monday, NC DHHS releases its latest estimates on the number of COVID-19 patients presumed to have recovered. That estimate is 14,954, and the calculation factors in the median recovery time for COVID-19, along with figures for people who did not die nor were hospitalized.
You can see more on how the state calculates this figure here.
As with any analysis, it's better to have more samples, or in this case, days of data, to get a better idea of the trends, but these measurements certainly warrant some monitoring over the next several days.

