
CHARLOTTE, N.C. — Droughts can last for months to years, but conditions can change quickly. That is why every Thursday, the U.S. Drought Monitor releases a map showing the level of drought for all 50 States and its territories.
The levels of the U.S. Drought Monitor
When looking at a drought monitor map, if your area is in white, there is no concern due to a surplus of rain.
But when the rain is lacking, it becomes a D0, or “abnormally dry.” This means lawns may be turning yellow to brown, some wilting vegetation and irrigation will increase for crops.
D0 is the lowest tier and the precursor to drought. After this, drought becomes official.
- Moderate Drought (D1) This is typically the point at which farmers begin noticing impacts to crops that may impact their overall yield. We may also see more widespread decreases in streamflow or even groundwater levels.
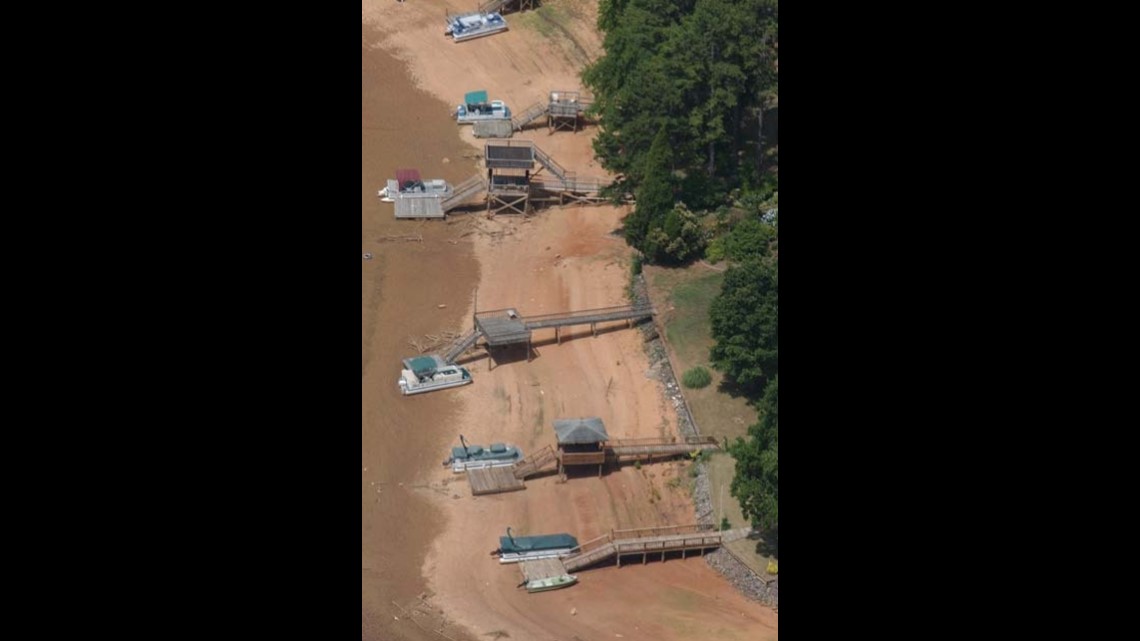
- Severe Drought (D2): Crop losses can become more widespread, Water conservation measures may be implemented to hold onto more water. This can close swimming areas and boat ramps due to lower water levels. Burn bans are more likely to prevent wildfires. Burn bans will likely be put in place.
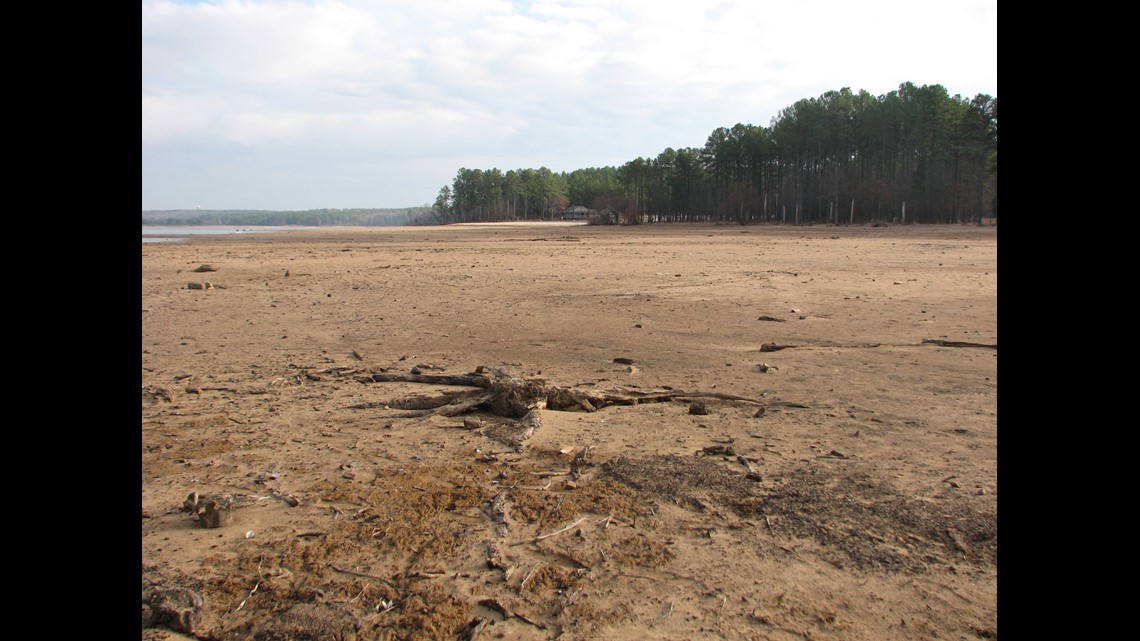
- Extreme Drought (D3): Impacts become even more widespread. Water restrictions tend to shift from voluntary to mandatory, if not already in place. Steam levels are extremely low. Aquatic life can begin to die. Lower lake levels may completely close some recreation areas. Drought at the D3 level in the spring or fall tends to be associated with large wildfires that become very difficult to contain or control.
- Exceptional Drought (D4): At this point, our daily lives are affected from mandatory water restrictions preventing you from watering your gardening, washing your car or even swimming in some locations. Farmers suffer substantial losses that can affect grocery prices. Reservoirs are low, well water is low, and a town or city’s water supply becomes critical.
Historic North Carolina droughts
1998-2002
This drought started in fall of 1998 and slowly intensified from west to east. Ironically, the wettest year on record occurred in 2003. High Rock Lake went as low as 24 feet down in the 2002 drought, since then they have changed their drought plan to avoid going that low. Jordan Lake reached 209.9 in August 2002, which was a little more than 6 feet below full pond.

For the latest weather alerts, download the WCNC Charlotte mobile app and enable push notifications.
2007-2008
Most droughts are slow in intensity and impacts occur over time; however, in this particular drought, conditions went from normal in May 2007 to exceptional drought before December 2007. (Approximately 10 feet down and about 30% of capacity), it filled on April 8, 2008.

How to overcome drought
So how do you overcome a drought? The obvious answer is more rain, but it is more complicated than that.
Winter is the best time to replenish rainfall, since vegetation does not need the water as much as in the spring. The general rule is slow and steady lessens the drought. A slow rain over a long period of time will soak into the water table .
Facts and information were checked from an interview with Linwood Peele. A Supervisor, at the Division of Water Resources from the North Carolina Department of Environmental Quality.
WCNC Charlotte’s Weather IQ YouTube channel gives detailed explainers from the WCNC Charlotte meteorologists to help you learn and understand weather, climate and science. Watch previous stories where you can raise your Weather IQ in the YouTube playlist below and subscribe to get updated when new videos are uploaded.